Introduction
Pfizer is one of the many companies around the world producing vaccines for COVID-19. Based on their trials, the Pfizer vaccine has a 95% efficacy rate. In this activity, we will explore what this efficacy rate means.
To start, imagine each of the 100 tiles below represents 1 person who received the Pfizer vaccine. Based on the 95% efficacy rate, change the color of each person you expect who will test positive for COVID-19.
Did you change the color of 5 tiles? If so, you interpreted the 95% efficacy rate in the same way as most people - you predict that 95 out of the 100 vaccinated people will not get COVID-19, while 5 out of 100 will. Analyzing the Pfizer data will help us see if this is the correct interpretation of the 95% efficacy rate.
The Trial Participants
Many people volunteered to participate in the Pfizer vaccine study. The canvas below represents half of the people that volunteered. Each tile stands for 10 people. Answer the questions underneath the tiles.
Half of the 43,660 participants received the actual vaccine and the other 21,830 people received a placebo. Participants in the placebo group did receive a shot, but the shot did not actually contain the vaccine.
The Placebo Group
The canvas below represents the 21,830 participants who received the placebo. How many of these people do you think ended up testing positive for COVID-19? Just make a guess by changing the colors of the tiles. Remember, each tile represents 10 people.
You can also select multiple tiles at once by clicking outside of the tiles and then dragging to highlight a group of them.

In fact, only 162 of the 21,820 people in the placebo group ended up testing positive for COVID-19. The canvas below shows 16 of the tiles in a different color to represent these 162 people.
The Vaccine Group - Your Prediction
Another 21,830 people received the actual Pfizer vaccine. If they hadn't received the vaccine, we'd expect a similar number of people - about 162 - to test positive for COVID-19. Fortunately, less than 162 people of this group ended up getting COVID-19. Predict how many less by changing the color back to orange of some of these red tiles. Use the pen tool or a text box to record the number of tiles you change from red to orange.
The Vaccine Group - Actual Results
To accurately reflect what happened in the Pfizer study, you should have changed 15 of the 16 red tiles back to orange.
This visual shows the vaccine prevented 150 of the 160 expected COVID-19 cases. 150 out of 160 is about 94%. However, the numbers in the study were not exact multiples of 10. As we've learned, 162 people in the placebo group tested positive for COVID.
In the vaccine group, only 8 people ended up testing positive. So, the vaccine eliminated 154 of the expected cases. Calculate this as a percent and enter your answer below. Round your answer to the nearest whole number.
The Efficacy Rate
You have just calculated the efficacy rate. The 95% efficacy rate means the vaccine prevented 95% of the cases we would expect if the group of 21,830 had not received the vaccine.
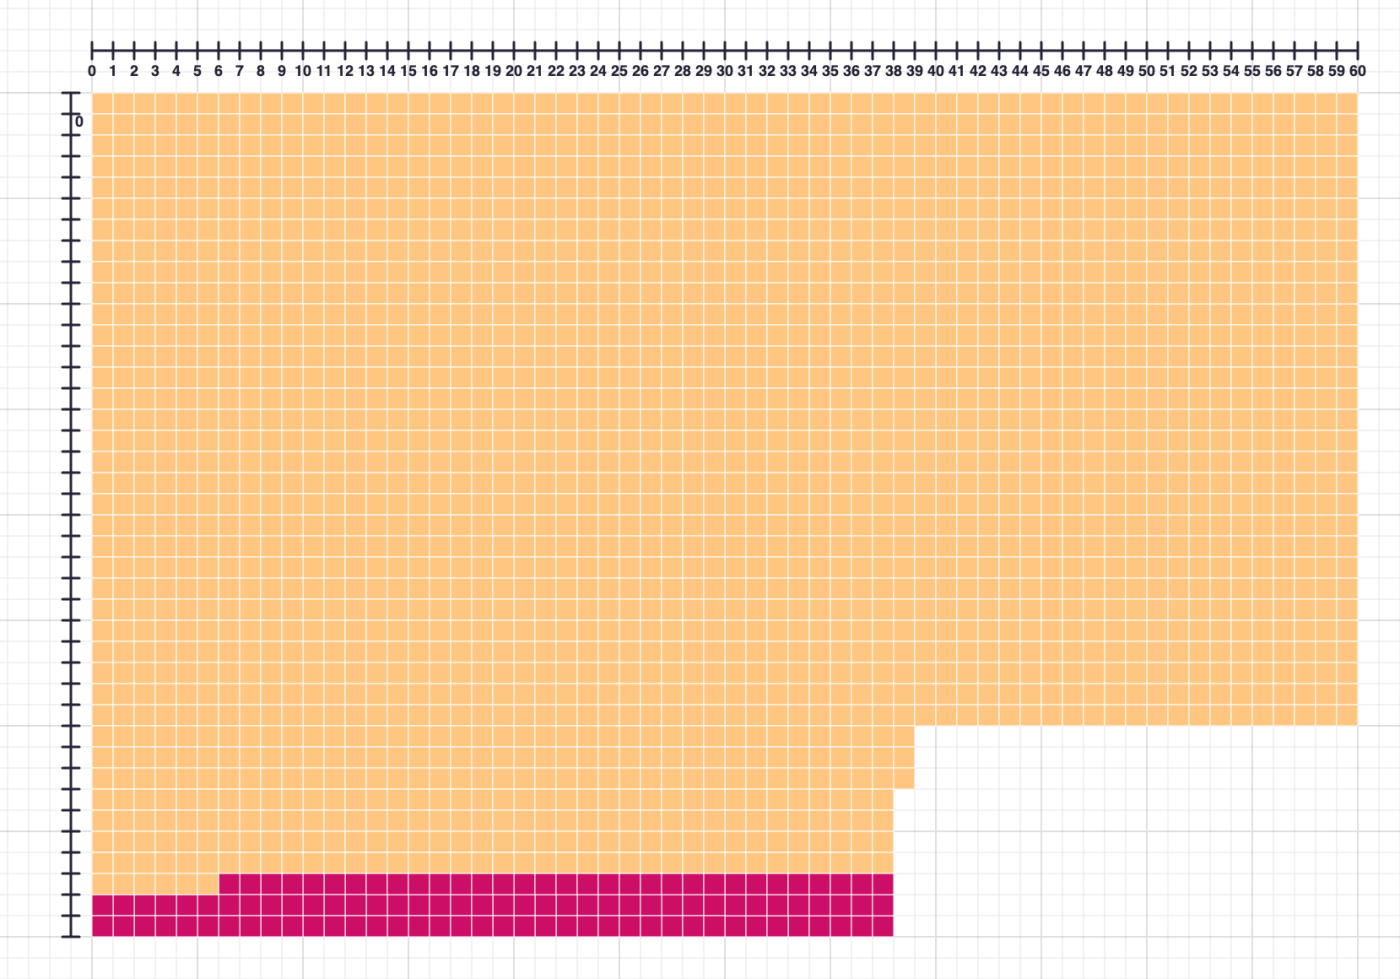
At the start of this activity, you may have thought the the 95% efficacy rate meant 5% of people who received the vaccine ended up testing positive for COVID-19. If that were true, about 1092 of the vaccinated participants would have tested positive for COVID-19 and our visual would look like this.
As we saw, it actually looks like this.
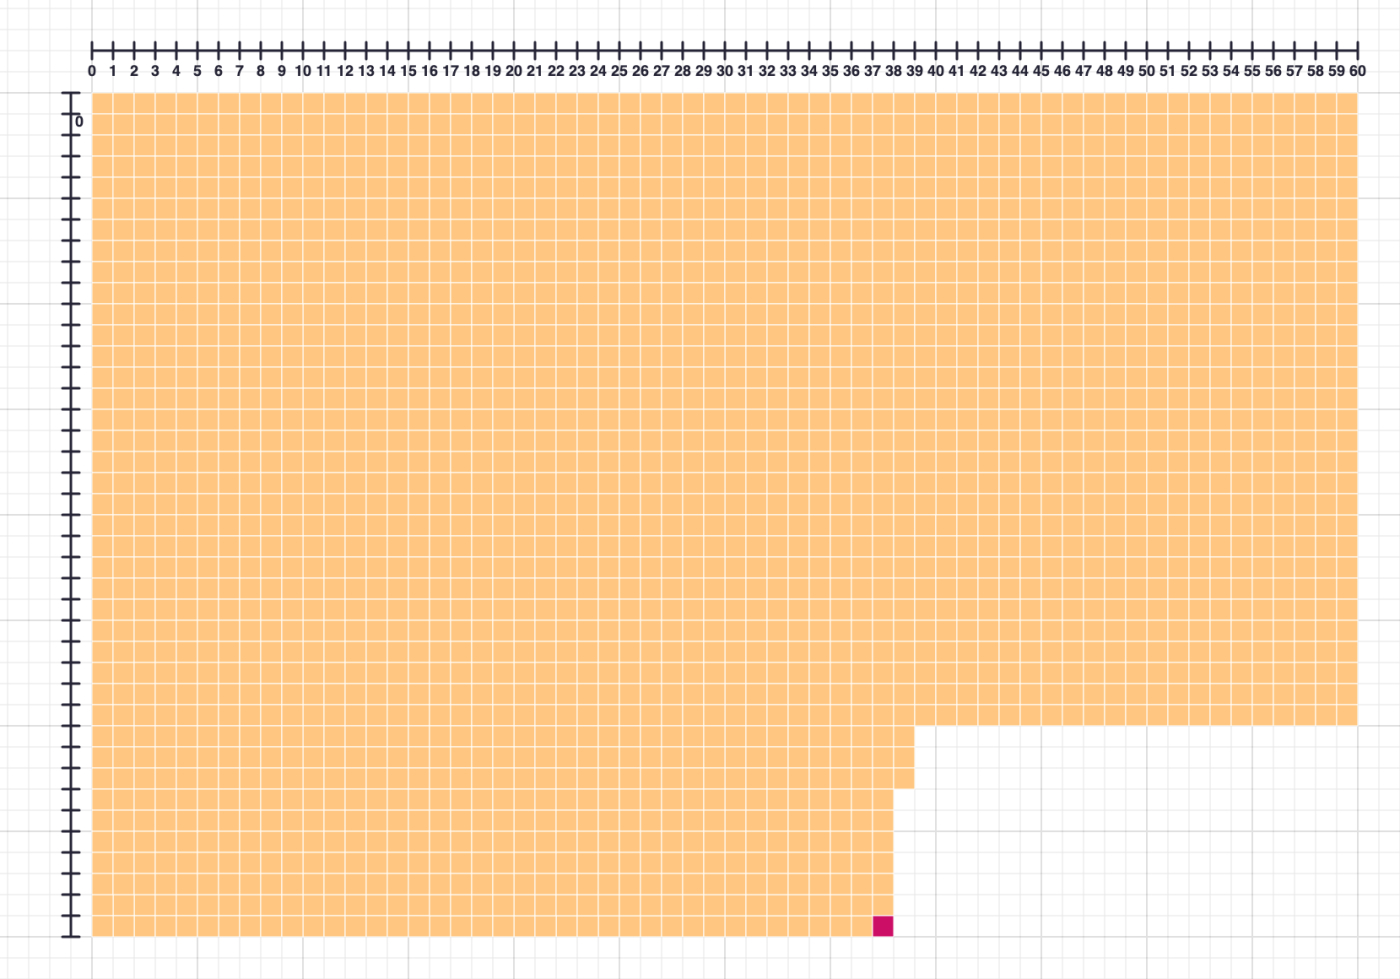
In summary, the 95% efficacy rate represents the how many cases the vaccine prevented when comparing the number of cases in the placebo group to the number of cases in the vaccine group. We can see this decrease when 15 of the 16 tiles turn from red to orange. The changing color of the tiles represents cases of COVID-19 the vaccine prevented.
Notes
- In the Pfizer study, only 0.74% of the people in the placebo group tested positive for COVID-19. Even better, only 0.04% of people in the vaccine group tested positive. The visuals in this exploration use these positivity rates. Do not use these positivity rates to assess your COVID-19 risk. Many factors, including the positivity rate in your community, impacts one's overall COVID-19 risk. The goal of this activity is to explore the math behind calculating a vaccine's efficacy rate.
- The Pfizer study actually included 43,661 participants. We use 43,660 in this task so the placebo group and the vaccine group have the same number of participants.
Credits and Further Reading
2 Companies Say Their Vaccines are 95% Effective. What Does That Mean?